Monitoring External Etcd Cluster With Prometheus Operator
The recommended way to run etcd for kubernetes is to have your etcd cluster outside of the kubernetes cluster. Great, good stuff. But you also run Prometheus via the Prometheus Operator to monitor everything about your cluster. So how do you get prometheus to monitor your etcd cluster if it isn’t technically a service in kubernetes? You might be thinking create a service monitor to scrape an external service like you’ve done before. But, you’ve secured your etcd cluster so you need client certs to talk to it right? Now we need a way to provide certs to the service monitor. We can do all of that by creating certs as kubernetes secrets and adding a tlsConfig to our service monitor. Let me walk you through the whole process.
If you’d like to just see the steps with no fluff and a repo of example files you can jump to the tldr
Service
First the service that will describe our etcd cluster must be created. Notice that the selector is null here. We are not auto-discovering any endpoints through selectors, but instead are going to manually define them.
apiVersion: v1
kind: Service
metadata:
  labels:
    k8s-app: etcd
  name: etcd
  namespace: kube-system
spec:
  clusterIP: None
  ports:
  - name: metrics
    port: 2379
    targetPort: 2379
  selector: null
Endpoints
Here were are going to list the endpoints for our etcd servers and then attach them to our service we created in the previous step. Change the IP addresses to match the IPs of your etcd servers. These IPs must exist as SANs in your etcd server certs or else this will not work. The way these endpoints are connected to the previously created service is through the name property of the metadata. This must match the name of the service you created.
apiVersion: v1
kind: Endpoints
metadata:
  labels:
    k8s-app: etcd
  name: etcd
  namespace: kube-system
subsets:
- addresses:
  - ip: 10.44.15.221
  - ip: 10.44.15.222
  - ip: 10.44.15.223
  ports:
  - name: metrics
    port: 2379
    protocol: TCP
Service Monitor
In order for the prometheus operator to easily discover and start monitoring your etcd cluster, a Service Monitor needs to be created. A Service Monitor is a resource defined by the operator that describes how to find a specified service to scrape, our etcd service for example. It also defines things such as how often to scrape, what port to connect to and additionally in this case a configuration for how to establish TLS connections.
The paths for the CA, client cert and key are the paths will will mount this files to inside the container. We will be generating these files and creating Kubernetes Secrets for them in the next steps.
apiVersion: monitoring.coreos.com/v1
kind: ServiceMonitor
metadata:
  labels:
    k8s-app: etcd
  name: etcd
  namespace: kube-system
spec:
  endpoints:
  - interval: 30s
    port: metrics
    scheme: https
    tlsConfig:
      caFile: /etc/prometheus/secrets/kube-etcd-client-certs/etcd-client-ca.crt
      certFile: /etc/prometheus/secrets/kube-etcd-client-certs/etcd-client.crt
      keyFile: /etc/prometheus/secrets/kube-etcd-client-certs/etcd-client.key
      serverName: etcd-cluster
  jobLabel: k8s-app
  selector:
    matchLabels:
      k8s-app: etcd
TLS configuration and Kubernetes Secrets
In order to speak to a secured etcd cluster we need client certificates. Using the CA that was used on the etcd cluster we can create a client certificate and key specifically for prometheus to use.
Create Etcd Client Certificates
In this example I am using cfssl to generate my cert and key, but you can use another tool such as OpenSSL if you prefer.
First we need a json file for cfssl to populate values in the cert. Use the following example. Save this file as etcd-client.json
{
    "CN": "etcd client",
    "hosts": [""],
    "key": {
        "algo": "rsa",
        "size": 2048
    },
    "names": [
        {
            "C": "US",
            "L": "CA",
            "ST": "San Francisco"
        }
    ]
}
The following command will generate two new files named etcd-client.pem and etd-client-key.pem
cfssl gencert -ca etcd/ca.crt -ca-key etcd/ca.key etcd-client.json | cfssljson -bare etcd-client
I like to rename them for easier use and identification.
mv etcd-client.pem etcd-client.crt
mv etcd-client-key.pem etcd-client.key
Create Kubernetes Secrets
Now that a certificate and key for prometheus has been created we are going to save them, along with the etcd ca as a kubernetes secret This will allow prometheus to securely connect to etcd.
kubectl -n monitoring create secret kube-etcd-client-certs --from-file=etcd-client-ca.crt=etcd-client.ca.crt --from-file=etcd-client.crt=etcd-client.crt --from-file=etcd-client.key=etcd-client.key
In the above snippet it is important that the secrets are created in the same namespace that the Prometheus Operator is running.
Update the prometheus yaml
We are almost done, this is the last file to modify before we can apply our changes. I like to use the kube-prometheus manifests for deploying the Prometheus Operator and accompanying tools such as alert manager and Grafana. These can be found in manifests/ or contrib/kube-prometheus/manifests/ depending on when you clone the Prometheus Operator git repo. Inside this directory is a file called prometheus-prometheus.yaml . We need to update this file to include the name of the secrets that we just created.
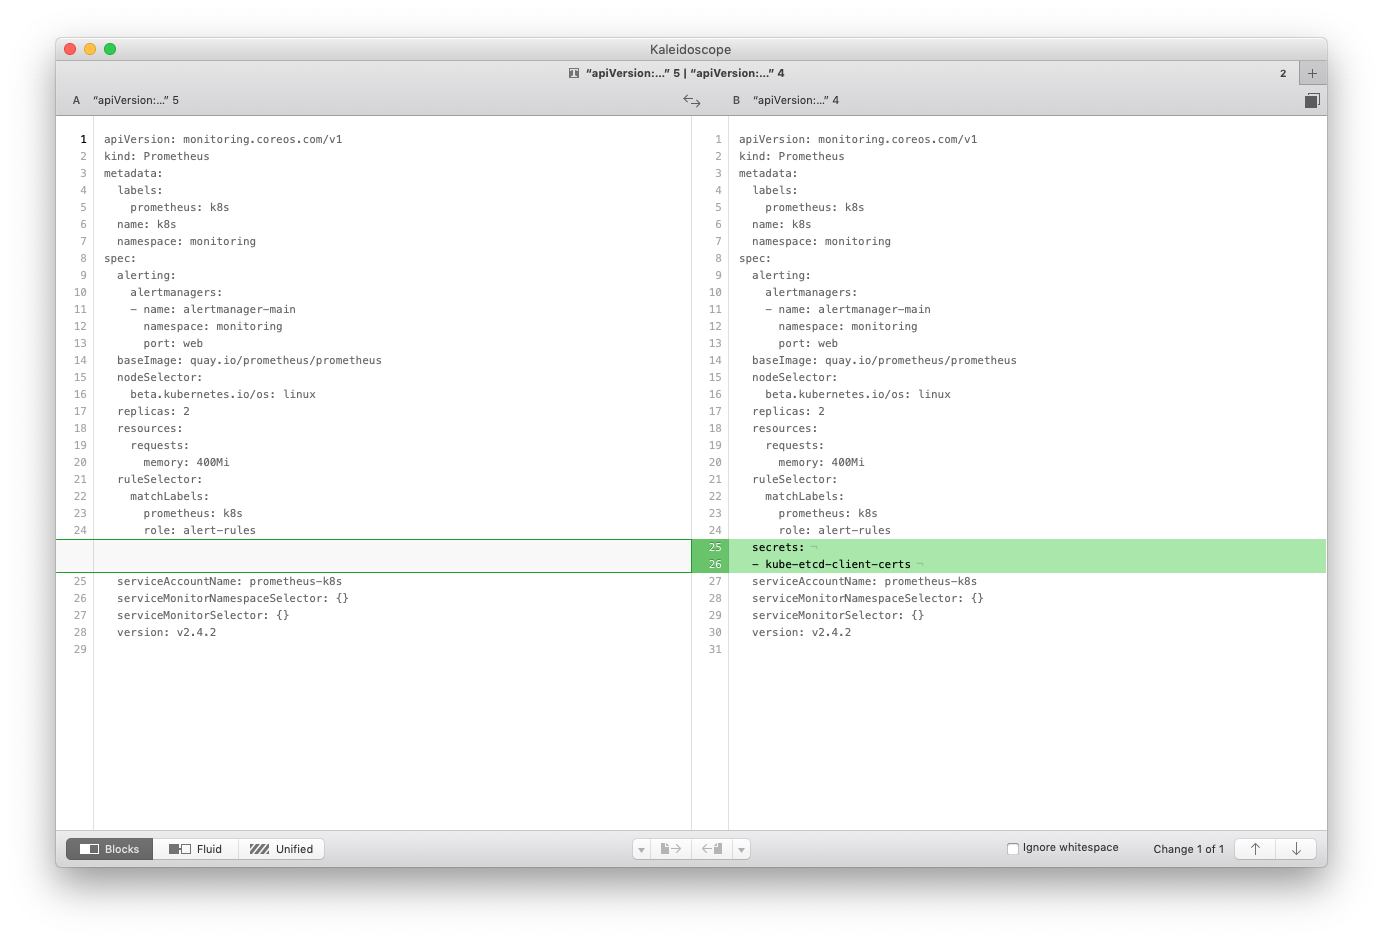
The end result should look something like the following
apiVersion: monitoring.coreos.com/v1
kind: Prometheus
metadata:
  labels:
    prometheus: k8s
  name: k8s
  namespace: monitoring
spec:
  alerting:
    alertmanagers:
    - name: alertmanager-main
      namespace: monitoring
      port: web
  baseImage: quay.io/prometheus/prometheus
  nodeSelector:
    beta.kubernetes.io/os: linux
  replicas: 2
  resources:
    requests:
      memory: 400Mi
  ruleSelector:
    matchLabels:
      prometheus: k8s
      role: alert-rules
  secrets:
  - kube-etcd-client-certs
  serviceAccountName: prometheus-k8s
  serviceMonitorNamespaceSelector: {}
  serviceMonitorSelector: {}
  version: v2.4.2
Apply it all
That’s it. Now we just need to apply these files to our cluster.
kubectl apply -f etcd-service.yaml
kubectl apply -f etcd-serviceMon.yaml
kubectl apply -f prometheus-prometheus.yaml
Conclusion
No you can successfully pull metrics from your etcd cluster. This is important because etcd is beating heart, or brain (dependidng on the analogy you like) of kubernetes. When things go bad, it can be often because of something happening to etcd. If things “feel slow”, often the root cause can be found in etcd somewhere. This is not to say etcd is bad, because it isn’t. But to say that all changes you make to your cluster pass through etcd, which is very performance sensitive. In order to solve an issue you need to have awareness of the issue. Preferably because of your metrics and appropriate alerts you see it coming and is resolved before you have an issue.
TLDR
repo with all example yaml files github.com/jpweber/monitor-etcd-prometheus-examples
- Create etcd
Serviceresource. - Create
Endpointresource for the etcdService. - Generate client certificate and key.
- Save etcd CA, client cert and key as kubernetes secrets.
- Update prometheus-prometheus.yaml file.
- Apply your new files to cluster.