Monitor external services with the prometheus operator
Using the Prometheus Operator, the general way we define what targets should be scraped is using a ServiceMonitor This works great for services that are running in your cluster and already have a service definition. But how do you monitor something that lives outside of your cluster and does not have a Kubernetes service? We’ll create service that does not use selectors, manually define endpoints for that service. Finally create a service monitor for our newly created service.
Creating a service for external resources
The service definition for external resources is very similar to a normal service definition except we are not going to use Pod selectors. We will create the the service then define the endpoints ourselves.
kind: Service
apiVersion: v1
metadata:
 name: gopher-builder
spec:
 type: ClusterIP
 ports:
 - name: metrics
   port: 9000
   targetPort: 9000
This creates a service without the Pod selectors, which means it does not generate endpoints for matched pods. It does not know where to send traffic, but it does create a dns entry. In order for this service to be useful we must tell the service where to send traffic. To do this we are going to manually create endpoints for that service.
kind: Endpoints
apiVersion: v1
metadata:
 name: gopher-builder
subsets:
 - addresses:
     - ip: 10.60.7.2
   ports:
	   - name: metrics
       port: 9000
An important thing to point out here is the name property of your endpoint must match the name property of your service.
metadata:
 name: gopher-builder
As well as the name for your port.
ports:
  - name: metrics
    port: 9000
This is how the endpoints get associated with the service we created. Also important to note, the address or addresses in the endpoints definition must be IP addresses. Hostnames are not allowed here.
Now to confirm this is wired up correctly run the following command to see your service and its endpoints
kubectl describe svc service name
Your results should look something like the following. If your endpoints area is blank, there is a mistake somewhere in your service or endpoints definition.
Name:              gopher-builder
Namespace:         default
Labels:            <none>
Annotations:       kubectl.kubernetes.io/last-applied-configuration:
                     {"apiVersion":"v1","kind":"Service","metadata":{"annotations":{},"name":"gopher-builder","namespace":"default"},"spec":{"ports":[{"name":"...
Selector:          <none>
Type:              ClusterIP
IP:                172.20.121.109
Port:              metrics  9000/TCP
TargetPort:        9000/TCP
Endpoints:         10.60.7.2:9000
Session Affinity:  None
Events:            <none>
The Service Monitor
Now that we have a Kubernetes service pointing to our external gopher-builder service we need to create a service monitor so the prometheus operator can discover this target. Make certain the port names match in the service monitor and the service definition or prometheus will not consider this a service that matches the service monitor and will not scrape it.
Also note the namespace selector, make sure you are searching for your service in the correct namespace. Finally, service monitors are always to be created in the same namespace that the prometheus operator is running in. A commonly used namespace is monitoring
apiVersion: monitoring.coreos.com/v1
kind: ServiceMonitor
metadata:
  labels:
    k8s-app: gopher-builder
  name: gopher-builder
  namespace: monitoring
spec:
  endpoints:
  - interval: 30s
    port: metrics
  namespaceSelector:
    matchNames:
    - default
  selector:
    app: gopher-builder
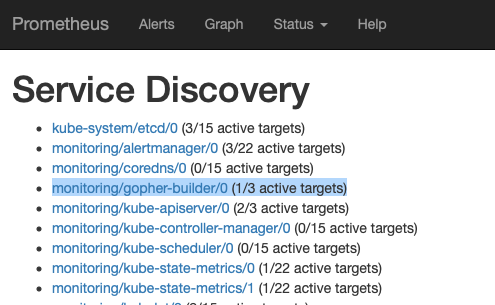
Here you can see the highlighted line shows that prometheus has found 1 service in the default namespace that matches our service monitor selection rules for the gopher-builder service.
While this may seem like a use case that not many people need, it is useful for the times you will need it. Such as monitoring an external etcd cluster.